


Leveraging AI (for Free) in Stock Picking
How to accelerate learning and save hours with less than 10 minutes of effort?

Investors seeking information have more tools at their disposal than ever before. In this post, we’ll go through one of my favorite ways to use AI to both speed up learning and save time—at no cost.
We’ll apply what we learn using the example of Kone’s competitor, the elevator company OTIS.

SEEK AND YOU SHALL FIND
There’s no shortage of raw data. I remember the days when I spent hours compiling the numbers I needed from reports into spreadsheets. Today, numerous data collection services are already excellent at aggregating information from income statements, balance sheets, and cash flow statements.
Massive tables of figures are now available to everyone for free in just seconds through services like roic.ai (I’ve written more extensively about free data sources for investors on my old blog).
Many investment theses, however, may ultimately boil down to something entirely different from traditional financial metrics, such as forward-looking order book development or industry-specific commentary. Even though this is just one example, traditional data collection services typically fall behind at this stage.
So, what’s the solution?
HOW TO GET STARTED
At first, it requires a bit of effort, but less than 10 minutes of work is a small price to pay for potentially saving hours later. High return on invested time (ROIT).
We’ll be using a tool provided by Google called NotebookLM. To use it, all you need is a Google account, which most people already have.
The goal is to provide the tool with all the essential information—either as links or files—that we want to use as the basis for drawing conclusions. This is the content from which we can later extract the insights we need.
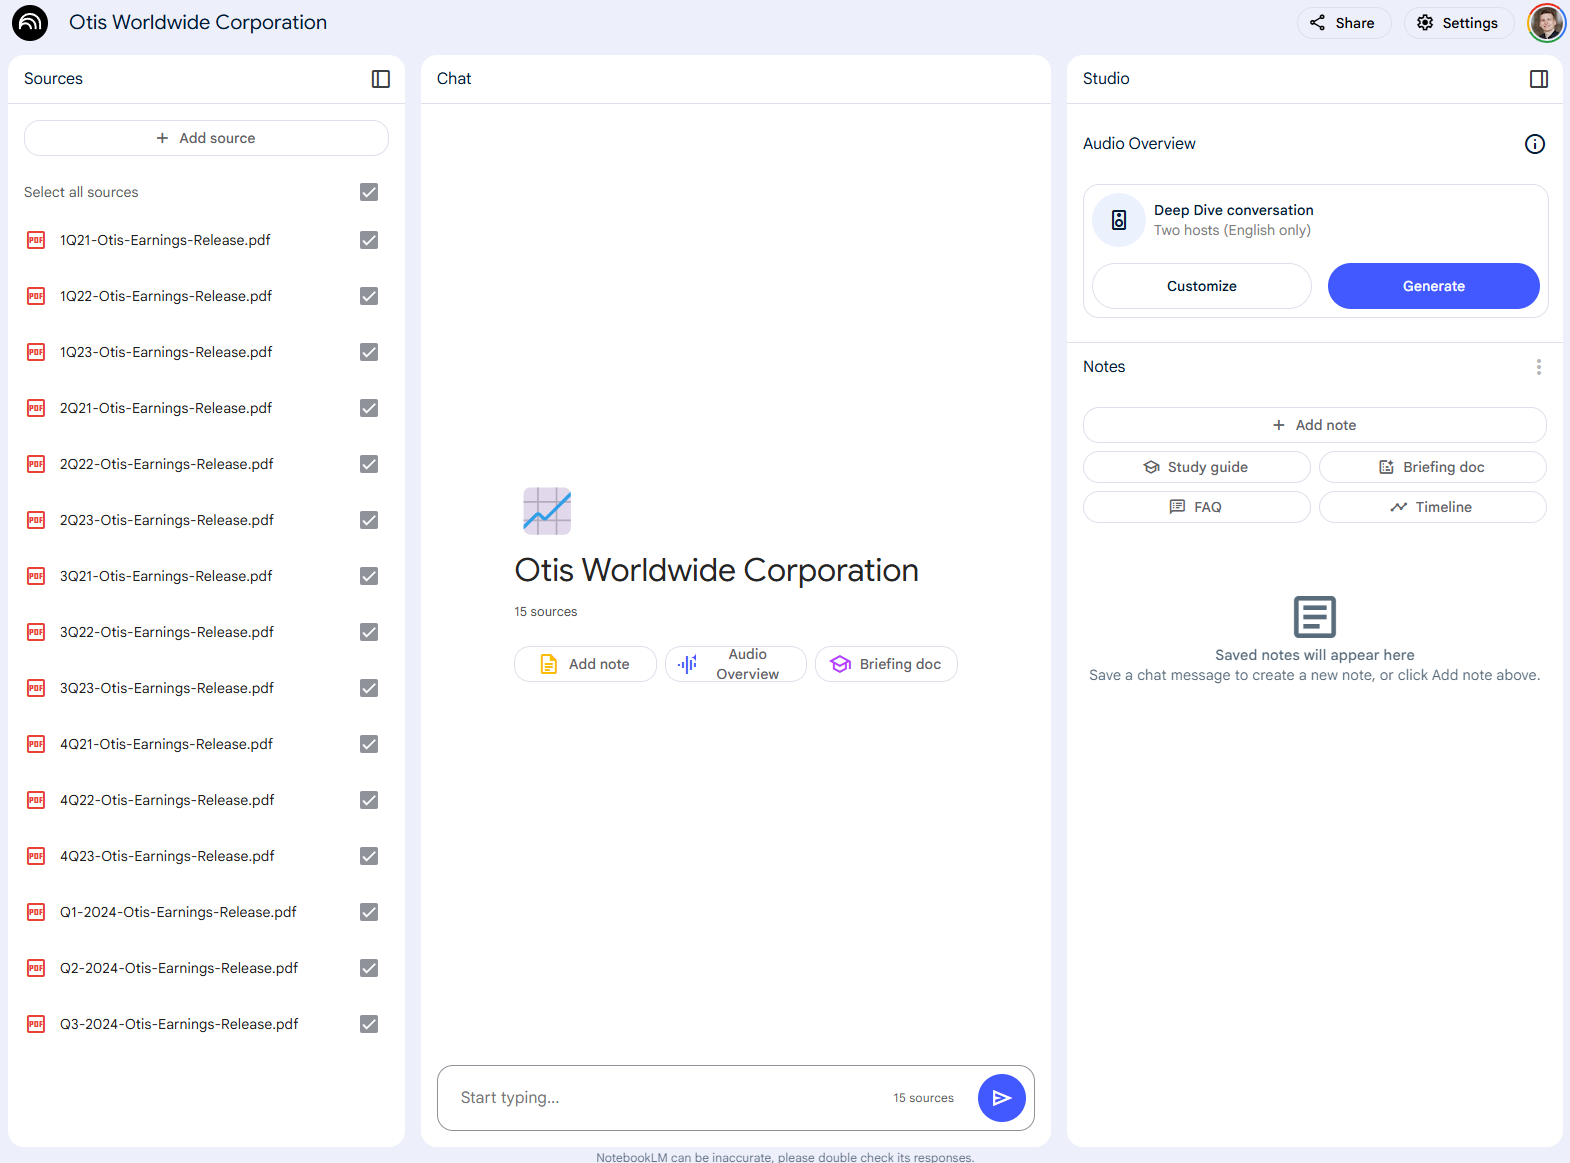
To start, we’ll download the company’s quarterly reports from recent years. In Otis’s case, the results are neatly archived on the company’s investor relations website.

You can use any data or time frame you prefer, but this time we’ll focus on the quarterly reports from 2021 to 2024. Create a new project in NotebookLM by clicking “+ Create new.”

You can add up to 50 sources, including text, presentations, audio, videos, or links. The model supports nearly 40 languages, including Finnish, although likely with less proficiency compared to English.

At this stage, you can achieve the same result in two ways:
Drag & Drop PDF: Download each earnings release as a PDF file to your computer and upload the files to the platform.
Link Website: Copy and paste the link for each earnings release directly into the platform.
This time, I opted to download all quarterly earnings reports from 2021 to my computer and upload them to the system. Once the data is submitted, you can begin leveraging the groundwork you’ve prepared.
USING THE TOOL
The AI has now been "fed" publicly available information, and we can start compiling the desired insights based on it (Note: always exercise caution with confidential information). As with any use of AI, the way you frame your questions plays a crucial role, and it’s worth practicing through experimentation. An imprecise question will lead to imprecise answers.
Let’s begin with the fundamentals. For example, we can ask a question like, “explain with one sentence, what does Otis do?” The question can be posed in several languages. While responses from language models can vary, in testing, I received the following answer:
"Otis is the world's leading company for manufacturing, installing, and servicing elevators and escalators."
Best of all, NotebookLM also provides references to the documents used, which you can review or explore further to deepen your understanding.
However, this was a very general question, one that could be answered through many other means. Personally, I don’t find such a question particularly useful—probably neither would you.
So, let’s raise the bar.

Since I’ve already spent some time reviewing Otis, I’m able to ask more demanding questions about its business or request tables on various topics.
Next, I want to find out how revenue from New Equipment and Service has developed on a quarterly basis. I ask for the data in table format and in chronological order to ensure it’s presented in the format I need:
"Create a table in chronological order for all quarters available which includes revenue from both ‘New Equipment’ and ‘Service’.”
This approach not only provides structured data but also ensures the results are easy to interpret and analyze further.

As a stock picker, I typically examine figures on an annual basis, so I want to “annualize” the data—that is, calculate the rolling sum of four quarters.
This is done with simple prompt:
"Recreate table but annualize both revenue columns, i.e. calculate the rolling sum of four quarters.”
This provides a clearer view of longer-term trends and smooths out any seasonal fluctuations, making it easier to assess the company’s overall performance trajectory.

Unlike its competitor Kone, Otis also reports the profitability of its service business. Let’s request that breakdown next:
"Recreate the quarterly table but instead of revenue, apply it to operating profit for both segments."
This allows us to compare the performance of the New Equipment and Service segments on a profitability basis, providing deeper insights into which area drives more value for the company.

The service business is clearly the profitability driver for Otis. What’s most impressive is how NotebookLM, without being prompted, highlights a change in the definition of operating profit in the first quarter of 2024. This is something that could easily go unnoticed.
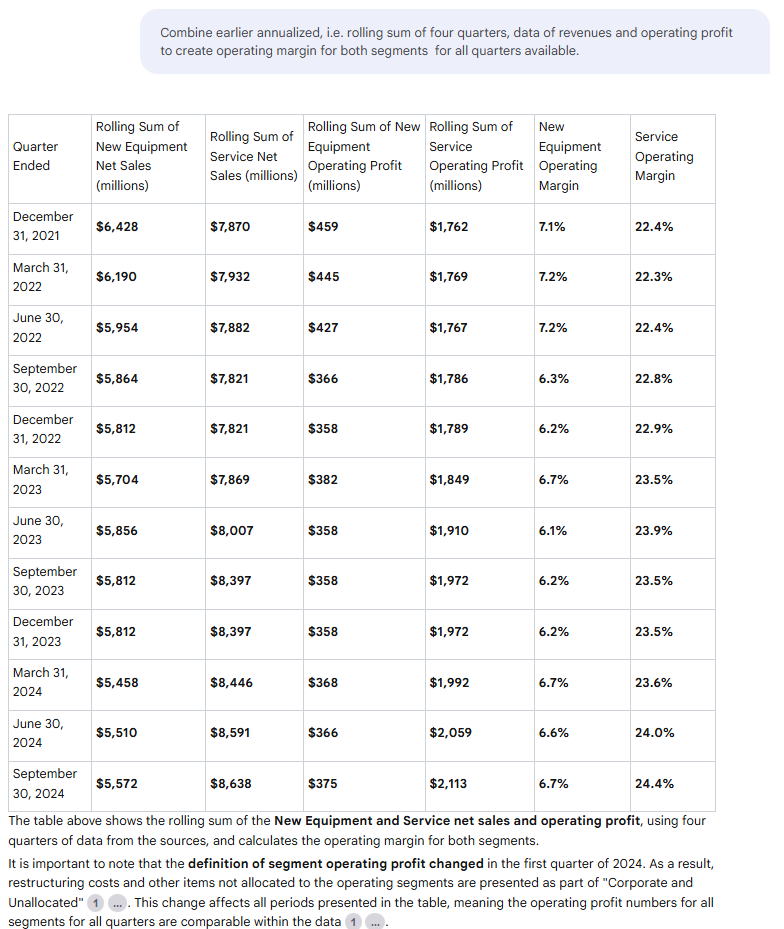
We can also combine these datasets and come up with operating margin:
"Combine earlier annualized, i.e. rolling sum of four quarters, data of revenues and operating profit to create operating margin for both segments for all quarters available.”
Works like a charm.
Finally, I want to understand the forward-looking order book for New Equipment. This is a solid foundation for the growing and significantly more profitable service business, as new equipment sales drive future maintenance service revenue. Let’s request that next:
"Create a chronological table with quarterly data on ‘New Equipment’ orders for all quarters available.”
Once again, a highly useful summary for a stock picker, generated in just seconds.

As you’ve likely noticed by now, the only limit to applying this tool is your imagination. Once you get the hang of it, you’ll undoubtedly discover unique angles for the companies that interest you. You’ll get the most out of this method by first skimming through a single earnings release to identify perspectives you’d like to explore further or gather long-term data to better understand the bigger picture.
The tool can also be applied to other purposes. For instance, I’ve used it to interpret and search for information in the technical documentation of our home. It’s important to note that AI makes mistakes, and for critical matters, it’s wise to cross-check information directly from the source.
It’s possible that in the future, all stock pickers will use similar tools, potentially eroding any relative advantage one might feel they’re gaining now. However, by being among the first to explore new tools, you can ensure you don’t fall behind the curve. In investing, that alone is a significant advantage.
FINAL WORDS
I write about themes that are useful for stock pickers with the aim of saving investors’ time, reaching as many readers as possible, and keeping the content free in the future as well.
By subscribing to this Substack below and sharing the post, you help support this mission.
For a more comprehensive look at my thoughts on stock picking, check out my book “Tähtäimessä osakkeet” and my investing course. They’re designed to help you get started in investing or improve your existing skills—don’t forget to take advantage of tax deductions for these expenses.
Thank you to everyone who has already purchased either one of these resources for your support!
If you enjoyed this post or learned something new, consider following me on X or Bluesky.
You can also find other excellent content on money and stock picking in these Substack publications:
, , and.Thank you so much for reading!
Thanks for the shout-out! 🙂